Multiple Choice
TABLE 13- 11
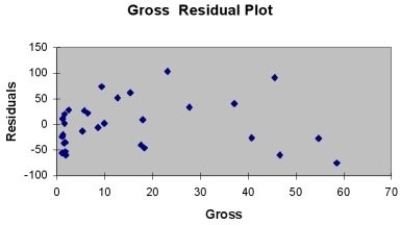
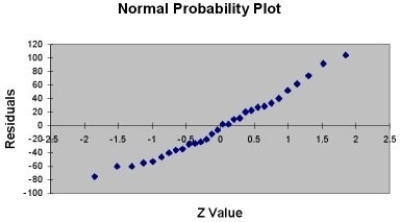
A company that has the distribution rights to home video sales of previously released movies would like to use the box office gross (in millions of dollars) to estimate the number of units (in thousands of units) that it can expect to sell. Following is the output from a simple linear regression along with the residual plot and normal probability plot obtained from a data set of 30 different movie titles:
ANOVA


-Referring to Table 13-11, which of the following is the correct interpretation for the slope coefficient?
A) For each increase of 1 dollar in box office gross, expected home video units sold are estimated to increase by 4.3331 thousand units.
B) For each increase of 1 million dollars in box office gross, expected home video units sold are estimated to increase by 4.3331 units.
C) For each increase of 1 dollar in box office gross, expected home video units sold are estimated to increase by 4.3331 units.
D) For each increase of 1 million dollars in box office gross, expected home video units sold are estimated to increase by 4.3331 thousand units.
Correct Answer:

Verified
Correct Answer:
Verified
Q48: TABLE 13-11<br>A computer software developer would like
Q99: TABLE 13-11<br>A computer software developer would like
Q104: TABLE 13-11<br>A computer software developer would like
Q111: TABLE 13-5<br>The managing partner of an advertising
Q122: TABLE 13-4<br> The managers of
Q126: TABLE 13-10<br>The management of a chain
Q127: TABLE 13-6<br>The following EXCEL tables are
Q128: TABLE 13-4<br>The managers of a brokerage
Q129: If the Durbin-Watson statistic has a value
Q173: TABLE 13-4<br>The managers of a brokerage firm