Solved

TABLE 13- 11
a Company That Has the Distribution Rights

Question 6

Multiple Choice

TABLE 13- 11
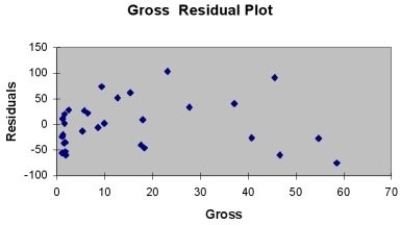
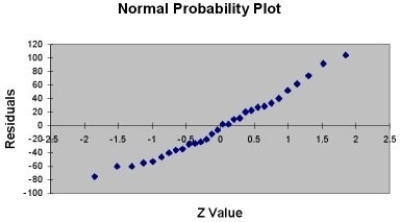
A company that has the distribution rights to home video sales of previously released movies would like to use the box office gross (in millions of dollars) to estimate the number of units (in thousands of units) that it can expect to sell. Following is the output from a simple linear regression along with the residual plot and normal probability plot obtained from a data set of 30 different movie titles:
 Regression Statistics  Multiple R 0.8531 RSquare 0.7278 Adjusted R Square 0.7180 Standard Error 47.8668 Observations 30\begin{array}{l}\text { Regression Statistics }\\\begin{array} { l c } \hline \text { Multiple R } & 0.8531 \\\text { RSquare } & 0.7278 \\\text { Adjusted R Square } & 0.7180 \\\text { Standard Error } & 47.8668 \\\text { Observations } & 30\end{array}\end{array}
ANOVA
 d f SS  MS Significance FRegression 1171499.78171499.7874.85052.1259E09Residual2864154.422291.23Total29235654.20\begin{array}{lrrrrr}\hline &\text { d f}& \text { SS } & \text { MS } & \text {F }& \text {Significance F} \\\hline \text {Regression }& 1 & 171499.78 & 171499.78 & 74.8505 & 2.1259E-09 \\\text {Residual} & 28 & 64154.42 & 2291.23 & & \\\text {Total} & 29 & 235654.20 & & & \\\hline\end{array}

Coefficients  Standard Error t Stat  p -value Lower 95% Upper 95%  Intercept 76.535111.83186.46865.24E0752.2987100.7716Gross4.33310.50088.65162.13E093.30725.3590\begin{array}{lrrrrrr}\hline & \text {Coefficients }& \text { Standard Error}& \text { t Stat }& \text { p -value }& \text {Lower 95\% }& \text {Upper 95\% }\\\hline \text { Intercept }& 76.5351 & 11.8318 & 6.4686 & 5.24 \mathrm{E}-07& 52.2987 & 100.7716 \\ \text {Gross} & 4.3331 & 0.5008 & 8.6516 & 2.13 \mathrm{E}-09 & 3.3072 & 5.3590 \\\hline\end{array}

 TABLE 13- 11 A company that has the distribution rights to home video sales of previously released movies would like to use the box office gross (in millions of dollars)  to estimate the number of units (in thousands of units)  that it can expect to sell. Following is the output from a simple linear regression along with the residual plot and normal probability plot obtained from a data set of 30 different movie titles:   \begin{array}{l} \text { Regression Statistics }\\ \begin{array} { l c }  \hline \text { Multiple R } & 0.8531 \\ \text { RSquare } & 0.7278 \\ \text { Adjusted R Square } & 0.7180 \\ \text { Standard Error } & 47.8668 \\ \text { Observations } & 30 \end{array} \end{array}   ANOVA  \begin{array}{lrrrrr} \hline &\text { d f}& \text { SS } & \text { MS } & \text {F }& \text {Significance F}  \\ \hline \text {Regression }& 1 & 171499.78 & 171499.78 & 74.8505 & 2.1259E-09 \\ \text {Residual} & 28 & 64154.42 & 2291.23 & & \\ \text {Total} & 29 & 235654.20 & & & \\ \hline\end{array}    \begin{array}{lrrrrrr} \hline &  \text {Coefficients }& \text { Standard Error}& \text { t  Stat }&  \text { p -value }&  \text {Lower 95\% }& \text {Upper 95\% }\\ \hline \text { Intercept }& 76.5351 & 11.8318 & 6.4686 & 5.24 \mathrm{E}-07& 52.2987 & 100.7716 \\  \text {Gross} & 4.3331 & 0.5008 & 8.6516 & 2.13 \mathrm{E}-09 & 3.3072 & 5.3590 \\ \hline \end{array}        -Referring to Table 13-11, which of the following assumptions appears to have been violated? A)  homoscedasticity B)  independence of errors C)  normality of error D)  none of the above  TABLE 13- 11 A company that has the distribution rights to home video sales of previously released movies would like to use the box office gross (in millions of dollars)  to estimate the number of units (in thousands of units)  that it can expect to sell. Following is the output from a simple linear regression along with the residual plot and normal probability plot obtained from a data set of 30 different movie titles:   \begin{array}{l} \text { Regression Statistics }\\ \begin{array} { l c }  \hline \text { Multiple R } & 0.8531 \\ \text { RSquare } & 0.7278 \\ \text { Adjusted R Square } & 0.7180 \\ \text { Standard Error } & 47.8668 \\ \text { Observations } & 30 \end{array} \end{array}   ANOVA  \begin{array}{lrrrrr} \hline &\text { d f}& \text { SS } & \text { MS } & \text {F }& \text {Significance F}  \\ \hline \text {Regression }& 1 & 171499.78 & 171499.78 & 74.8505 & 2.1259E-09 \\ \text {Residual} & 28 & 64154.42 & 2291.23 & & \\ \text {Total} & 29 & 235654.20 & & & \\ \hline\end{array}    \begin{array}{lrrrrrr} \hline &  \text {Coefficients }& \text { Standard Error}& \text { t  Stat }&  \text { p -value }&  \text {Lower 95\% }& \text {Upper 95\% }\\ \hline \text { Intercept }& 76.5351 & 11.8318 & 6.4686 & 5.24 \mathrm{E}-07& 52.2987 & 100.7716 \\  \text {Gross} & 4.3331 & 0.5008 & 8.6516 & 2.13 \mathrm{E}-09 & 3.3072 & 5.3590 \\ \hline \end{array}        -Referring to Table 13-11, which of the following assumptions appears to have been violated? A)  homoscedasticity B)  independence of errors C)  normality of error D)  none of the above
-Referring to Table 13-11, which of the following assumptions appears to have been violated?


A) homoscedasticity
B) independence of errors
C) normality of error
D) none of the above

Correct Answer:

verifed

Verified

Unlock this answer now
Get Access to more Verified Answers free of charge

Related Questions