Multiple Choice
TABLE 13- 11
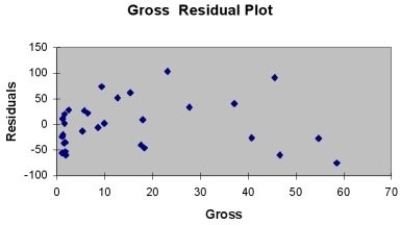
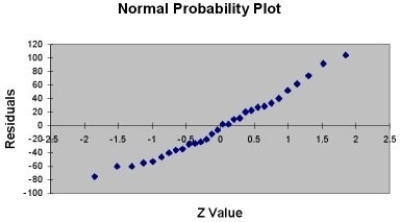
A company that has the distribution rights to home video sales of previously released movies would like to use the box office gross (in millions of dollars) to estimate the number of units (in thousands of units) that it can expect to sell. Following is the output from a simple linear regression along with the residual plot and normal probability plot obtained from a data set of 30 different movie titles:
ANOVA


-Referring to Table 13-11, which of the following is the correct interpretation for the coefficient of determination?
A) 72.8% of the variation in the box office gross can be explained by the variation in the video unit sales.
B) 71.8% of the variation in the video unit sales can be explained by the variation in the box office gross.
C) 71.8% of the variation in the box office gross can be explained by the variation in the video unit sales.
D) 72.8% of the variation in the video unit sales can be explained by the variation in the box office gross.
Correct Answer:

Verified
Correct Answer:
Verified
Q108: TABLE 13-10<br>The management of a chain electronic
Q130: TABLE 13-3<br>The director of cooperative education at
Q155: TABLE 13-4<br>The managers of a brokerage firm
Q186: TABLE 13- 11<br>A company that has
Q187: TABLE 13-10 <br> The management of
Q188: TABLE 13-2 <br> A candy bar
Q189: TABLE 13- 11<br>A company that has
Q191: TABLE 13- 11<br>A company that has
Q193: TABLE 13- 11<br>A company that has
Q195: You give a pre-employment examination to your