Multiple Choice
A foreman wants to use an  chart to control the average length of the bolts manufactured.He has recently collected the six samples given below.
 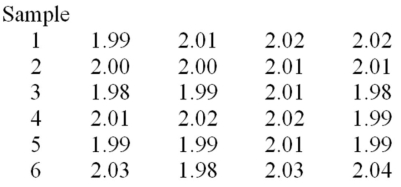 Calculate the average range.
A) .036
B) .18
C) .030
D) .05
Correct Answer:

Verified
Correct Answer:
Verified
Related Questions
Q10: In a manufacturing process,if the limits for
Q24: Reducing common causes of variation usually requires
Q39: Unusual sources of process variation that can
Q46: If 20 samples of size 7 are
Q47: A powder metal manufacturing company is producing
Q48: A motorcycle manufacturer produces the parts for
Q49: Assume that 25 samples of 50 each
Q51: If 20 samples of size 7 are
Q52: If <img src="https://d2lvgg3v3hfg70.cloudfront.net/TB1736/.jpg" alt="If and
Q53: A manufacturer of windows produces one type