Multiple Choice
Suppose that  and R charts based on subgroups of size 4 are being used to monitor the tire diameter of a new radial tire.The
  andR charts are found to be in statistical control with
 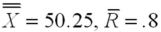 inches.A histogram of the tire diameter measurements indicates that these measurements are approximately normally distributed.Calculate the estimate of the percentage of tires that are out of specification.
A) 1.93%
B) 2.68%
C) 1.62%
D) 17.36%
Correct Answer:

Verified
Correct Answer:
Verified
Q7: From 20 samples of size 100,a total
Q26: A unit that fails to meet specifications
Q30: For a manufacturing process, <img src="https://d2lvgg3v3hfg70.cloudfront.net/TB1736/.jpg" alt="For
Q32: A motorcycle manufacturer produces the parts for
Q32: How well the design of a product
Q37: A motorcycle manufacturer produces the parts for
Q38: A motorcycle manufacturer produces the parts for
Q44: Assume that 25 samples of 50 each
Q46: If a process is only influenced by
Q113: Among other quality measures,the quality of an