Multiple Choice
Suppose that a tire manufacturer uses  and R charts based on subgroups of size 4 to monitor tire diameter.The
  andR charts are found to be in statistical control,with
 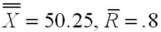 inches.A histogram of the tire diameter measurements indicates that these measurements are approximately normally distributed.Find the sigma level capability of the process.
A) 1.93
B) 3.22
C) 0.64
D) 0.22
Correct Answer:

Verified
Correct Answer:
Verified
Q4: If the process variability steadily increases,we would
Q11: How well the design of the product
Q13: Unusual sources of variation that can be
Q15: Sigma level capability is the number of
Q48: A sequence of steadily decreasing points on
Q52: A cause-and-effect diagram enumerates the potential causes
Q94: A powder metal manufacturing company is producing
Q100: A manufacturer of windows produces one type
Q102: A fastener company produces a certain type
Q104: Common causes of process variation:<br>A)Are sources of