Multiple Choice
The following frequency table summarizes the ages of 60 shoppers at the local grocery store. 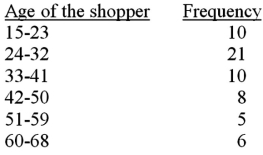 The sample mean for the above frequency table is calculated as 36.25.Calculate the approximate sample standard deviation for this data set.
A) 181.08
B) 184.15
C) 26.83
D) 13.46
E) 13.57
Correct Answer:

Verified
Correct Answer:
Verified
Related Questions
Q2: The local amusement park was interested in
Q46: Using grouped data of 14 classes with
Q58: The population mean is the point estimate
Q65: As the coefficient of variation _ risk
Q77: The average of the squared deviations of
Q78: A measure of the strength of the
Q99: Find the z-score for an IQ test
Q115: In a statistics class, 10 scores were
Q116: The median is the measure of central
Q119: The weights that are used in calculating