Multiple Choice
The US local airport keeps track of the percentage of flights arriving within 15 minutes of their scheduled arrivals.The stem-and-leaf plot of the data for one year is below. 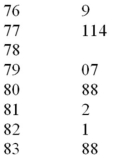 In developing a histogram of these data,how many classes would be used?
A) 4
B) 5
C) 6
D) 7
E) 8
Correct Answer:

Verified
Correct Answer:
Verified
Q3: When constructing any graphical display that utilizes
Q4: A CFO is looking at how much
Q5: The following is a relative frequency distribution
Q8: Consider the following data on distances traveled
Q10: The number of weekly sales calls by
Q14: If there are 62 values in a
Q14: In a Pareto chart,the bar for the
Q45: Consider the following data on distances traveled
Q94: The following is a relative frequency distribution
Q99: A histogram that tails out toward smaller