Multiple Choice
The US local airport keeps track of the percentage of flights arriving within 15 minutes of their scheduled arrivals.The stem-and-leaf plot of the data for one year is below. 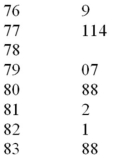 What would be the class length for creating the frequency histogram?
A) 1.4
B) 0.8
C) 2.7
D) 1.7
E) 2.3
Correct Answer:

Verified
Correct Answer:
Verified
Related Questions
Q20: A _ can be used to differentiate
Q28: The following table lists the types of
Q33: Stem-and-leaf displays and dot plots are useful
Q50: The number of weekly sales calls by
Q55: If there are 120 values in a
Q57: A local electronics retailer recently conducted a
Q58: Beginning the vertical scale of a graph
Q63: A CFO is looking at how much
Q88: A _ displays the frequency of each
Q89: A graphical portrayal of a quantitative data