Essay
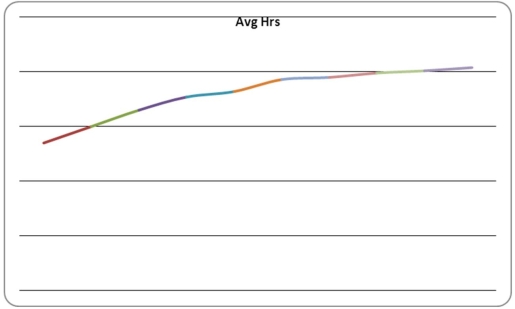
Using the following data table of the average hours per week spent on Internet activities by 15- to 18-year-olds for the years 1999-2008,construct the runs plot and interpret.
Correct Answer:

Verified
Hours spent on the Internet have increas...View Answer
Unlock this answer now
Get Access to more Verified Answers free of charge
Correct Answer:
Verified
View Answer
Unlock this answer now
Get Access to more Verified Answers free of charge
Q3: A(n)_ variable is a qualitative variable such
Q5: Temperature (in degrees Fahrenheit)is an example of
Q6: Selecting many different samples and running many
Q7: If we collect data on the number
Q8: Measurements from a population are called<br>A)Elements.<br>B)Observations.<br>C)Variables.<br>D)Processes.
Q9: When the data being studied are gathered
Q11: Data collected for a particular study are
Q15: A random sample is selected so that
Q27: _ is a necessary component of a
Q42: Statistical inference is the science of using