Essay
An investor wants to compare the risks associated with two different stocks. One way to measure the risk of a given stock is to measure the variation in the stock's daily price changes. The investor obtains a random sample of 20 daily price changes for stock 1 and 20 daily price changes for stock 2. These data are shown in the table below. Show how this investor can compare the risks associated with the two stocks by testing the null hypothesis that the variances of the stocks are equal. Use  = 0.10 and interpret the results of the statistical test.
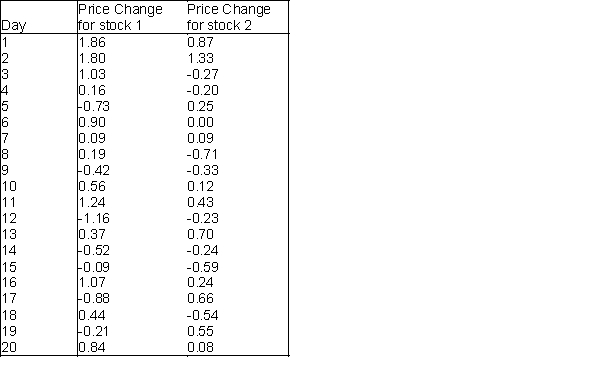
Correct Answer:

Verified
 vs. Test statistic: F-value= and p...
View Answer
Unlock this answer now
Get Access to more Verified Answers free of charge
Correct Answer:
Verified
View Answer
Unlock this answer now
Get Access to more Verified Answers free of charge
Q6: Side-by-side box plots are typically a good
Q35: A null hypothesis is a statement about
Q46: The p-value of a sample is the
Q48: An automobile manufacturer needs to buy aluminum
Q50: The power of a test is the
Q51: The chi-square test for normality makes a
Q52: The = sign belongs in the null
Q53: (A) Assume that the national average weekly
Q55: Q-Mart is interested in comparing customers who
Q56: The null and alternative hypotheses divide all