Essay
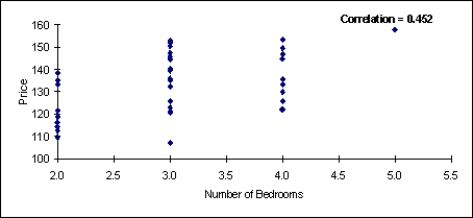
There are two scatterplots shown below. The first chart shows the relationship between the size of the home and the selling price. The second chart examines the relationship between the number of bedrooms in the home and its selling price. Which of these two variables (the size of the home or the number of bedrooms) seems to have the stronger relationship with the home's selling price? Justify your answer. 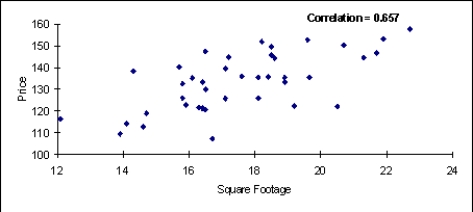
Correct Answer:

Verified
The relationship between selling price a...View Answer
Unlock this answer now
Get Access to more Verified Answers free of charge
Correct Answer:
Verified
View Answer
Unlock this answer now
Get Access to more Verified Answers free of charge
Q17: We cannot attempt to interpret correlations numerically,with
Q27: An example of a joint category of
Q40: Strongly related variables may have a correlation
Q42: Correlation and covariance can be used to
Q45: The tables of counts that result from
Q47: If the standard deviation of X is
Q48: How would you characterize the relationship between
Q49: Correlation is useful only for:<br>A) assessing the
Q50: Suppose that a health magazine reports that
Q52: A line or curve superimposed on a