Essay
The following scatterplot compares the selling price and the appraised value. 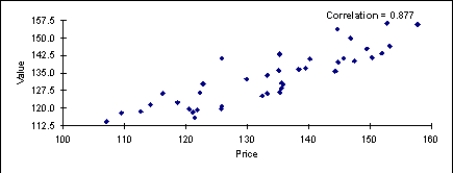 Is there a linear relationship between these two variables? If so, how would you characterize the relationship?
Correct Answer:

Verified
Yes, there is a linear relationship. Cor...View Answer
Unlock this answer now
Get Access to more Verified Answers free of charge
Correct Answer:
Verified
View Answer
Unlock this answer now
Get Access to more Verified Answers free of charge
Q7: Statisticians often refer to the pivot tables
Q15: The cutoff for defining a large correlation
Q33: If the coefficient of correlation r =
Q36: Comparing a numerical variable across two or
Q49: One characteristic of "paired variables" is that<br>A)one
Q72: Counts for categorical variable are often expressed
Q73: Which correlation coefficient suggests the strongest relationship?<br>A)
Q76: If the sample is a good representation
Q78: We study relationships among numerical variables using:<br>A)
Q179: What percentage of the students in the