Essay
The data below represents monthly sales for two years of beanbag animals at a local retail store (Month 1 represents January and Month 12 represents December). Given the time series plot below, do you see any obvious patterns in the data? Explain. 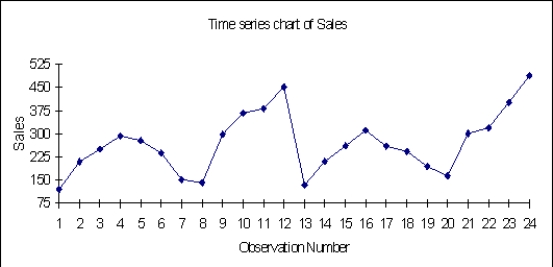
Correct Answer:

Verified
This is a representation of seasonal dat...View Answer
Unlock this answer now
Get Access to more Verified Answers free of charge
Correct Answer:
Verified
View Answer
Unlock this answer now
Get Access to more Verified Answers free of charge
Q8: A variable (or field or attribute)is a
Q41: The daily closing values of the Dow
Q59: Mean absolute deviation (MAD)is the average of
Q66: With symmetric, "bell-shaped" distributions, approximately what percent
Q67: How many job applicants scored above 50?
Q68: Indicate the type of data for each
Q70: A sample of 8 observations with a
Q72: If the mean is 75 and two
Q73: The average score for a class of
Q74: A histogram is based on binning the