Essay
An operations management professor is interested in how her students performed on her midterm exam. The histogram shown below represents the distribution of exam scores (where the maximum score is 100) for 50 students. 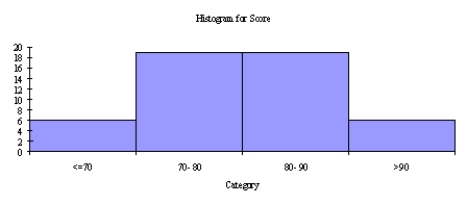 Based on this histogram, how would you characterize the students' performance on this exam?
Correct Answer:

Verified
Exam scores are fairly normall...View Answer
Unlock this answer now
Get Access to more Verified Answers free of charge
Correct Answer:
Verified
View Answer
Unlock this answer now
Get Access to more Verified Answers free of charge
Q16: Coding males as 1 and females as
Q17: In a generic box plot, the asterisk
Q18: What can you say about the shape
Q19: Assume that the histogram of a data
Q20: In an effort to provide more consistent
Q20: The mean is a measure of central
Q22: A political figure running for re-election claimed
Q23: In an extremely right-skewed distribution, the mean
Q24: How would you describe the salary of
Q26: As a measure of variability, what is