Essay
Based on the histogram shown below, how would you describe the salary distribution for these data? 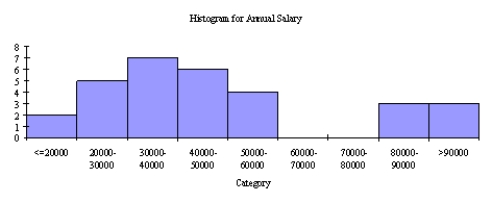
Correct Answer:

Verified
The salary distribution is skewed to the...View Answer
Unlock this answer now
Get Access to more Verified Answers free of charge
Correct Answer:
Verified
The salary distribution is skewed to the...
View Answer
Unlock this answer now
Get Access to more Verified Answers free of charge
Related Questions
Q41: The daily closing values of the Dow
Q59: Mean absolute deviation (MAD)is the average of
Q72: If the mean is 75 and two
Q73: The average score for a class of
Q74: A histogram is based on binning the
Q78: What are the three most common measures
Q79: Explain why the mean is slightly lower
Q80: If a value represents the 95<sup>th</sup> percentile,
Q81: Suppose that an analysis of a set
Q82: The data shown below contains family incomes