Short Answer
The histogram below represents scores achieved by 250 job applicants on a personality profile. 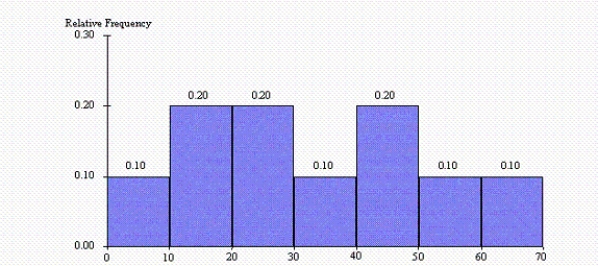
-What percentage of the job applicants scored between 30 and 40?
Correct Answer:

Verified
Correct Answer:
Verified
Related Questions
Q20: The mean is a measure of central
Q22: A political figure running for re-election claimed
Q23: In an extremely right-skewed distribution, the mean
Q24: How would you describe the salary of
Q26: As a measure of variability, what is
Q29: Calculate the interquartile range. What does this
Q30: In the term "frequency table," frequency refers
Q31: Statistics professor has just given a final
Q32: Expressed in percentiles, the interquartile range is
Q65: The median is one of the most