Essay
A think tank of economists is interested in how the distribution of family income has changed in Country X during the last 20 years. The summary measures and histograms shown below are generated for a sample of 500 family incomes, using the 1997 and 2017 income for each family in the sample.
Summary Measures (in thousands of dollars): 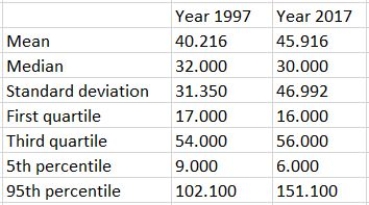
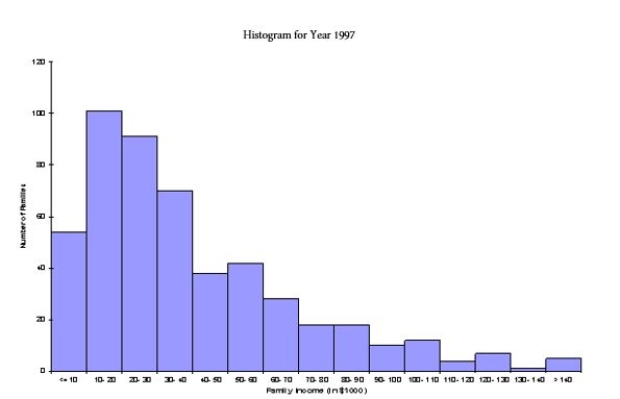
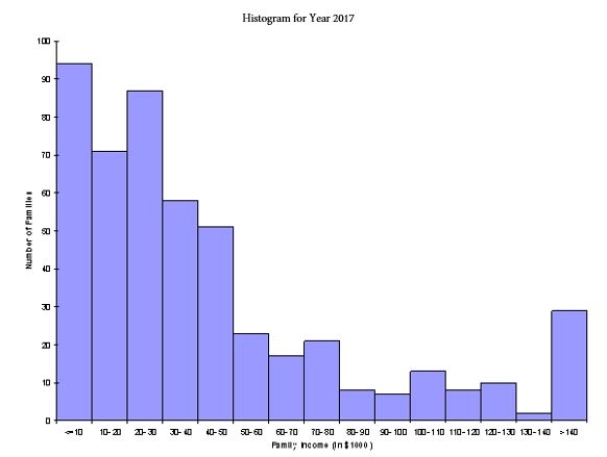 Based on these results, discuss as completely as possible how the distribution of family income in Country X changed from 1997 to 2017.
Correct Answer:

Verified
These summary measures say quite a lot. ...View Answer
Unlock this answer now
Get Access to more Verified Answers free of charge
Correct Answer:
Verified
View Answer
Unlock this answer now
Get Access to more Verified Answers free of charge
Q4: The median of a data set with
Q23: As a graphical tool,the histogram is ideal
Q30: Data can be categorized as cross-sectional or
Q32: Age,height,and weight are examples of numerical data.
Q60: There are four quartiles that divide the
Q90: The length of the box in the
Q91: What measure of distribution relates to extreme
Q96: A variable is classified as ordinal if:<br>A)
Q97: Excel<sup>®</sup> stores dates as:<br>A) numbers<br>B) variables<br>C) records<br>D)
Q99: In order for the characteristics of a