Essay
The data shown below contains the monthly sales (in thousands of dollars) at a local department store for each of the past 24 months. 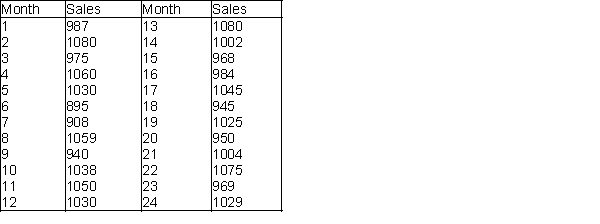
-(A) Develop a time series plot of the data.
(B) Perform a runs test and compute a few autocorrelations to determine whether this time series is random.
(C) Given your answers to (A) and (B), what type of forecast do you recommend? Explain your answer.
(D) Use your answer to (C), to obtain a forecast for the next quarter (4 months). How reliable do you think this forecast is?
Correct Answer:

Verified
(A)  (B) The data are clearly random. T...
View Answer
Unlock this answer now
Get Access to more Verified Answers free of charge
Correct Answer:
Verified
View Answer
Unlock this answer now
Get Access to more Verified Answers free of charge
Q1: In a moving averages method, which of
Q2: A linear trend means that the time
Q3: Suppose that simple exponential smoothing with <img
Q6: What is a component of a time
Q8: In a multiplicative seasonal model,we multiply a
Q10: Forecasting models can be divided into three
Q11: If a random series has too few
Q11: The quarterly numbers of applications for home
Q23: Extrapolation methods attempt to<br>A)use non-quantitative methods to
Q63: If the observations of a time series