Essay
A carpet company, which sells and installs carpet, believes that there should be a relationship between the number of carpet installations that they will have to perform in a given month and the number of building permits that have been issued within the county where they are located. Below you will find a regression model that compares the relationship between the number of monthly carpet installations (Y) and the number of building permits that have been issued in a given month (X). The data represents monthly values for the past 10 months. 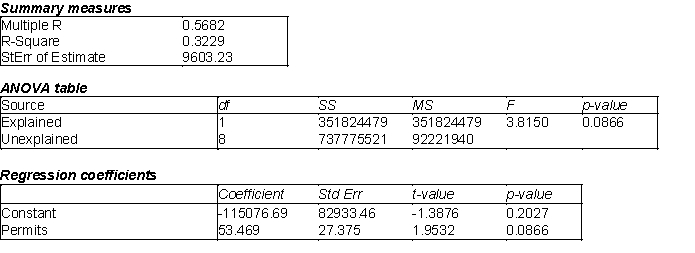
-(A) Estimate the regression model. How well does this model fit the given data?
(B) Yes, there is a linear relationship between the number of carpet installations and the number of building permits issued at a = 0.10; The p-value = 0.0866 for the F-ratio. You can conclude that there is a significant linear relationship between these two variables.
(C) The Durbin-Watson statistic for this data was 1.2183. Given this information what would you conclude about the data?
(D) Given your answer in (C), would you recommend modifying the original regression model? If so, how would you modify it?
Correct Answer:

Verified
(A)  = -115076.69 + 53.469 ; since = 0...
View Answer
Unlock this answer now
Get Access to more Verified Answers free of charge
Correct Answer:
Verified
View Answer
Unlock this answer now
Get Access to more Verified Answers free of charge
Q10: In regression analysis,homoscedasticity refers to constant error
Q34: Homoscedasticity means that the variability of Y
Q38: One method of diagnosing heteroscedasticity is to
Q46: In regression analysis, the total variation in
Q46: One method of dealing with heteroscedasticity is
Q47: Suppose you run a regression of a
Q48: One of the potential characteristics of an
Q52: The appropriate hypothesis test for a regression
Q54: In multiple regressions, if the F-ratio is
Q61: In regression analysis,the unexplained part of the