Essay
The information below represents the relationship between the selling price (Y, in $1,000) of a home, the square footage of the home (  ), and the number of rooms in the home (
  ). The data represents 60 homes sold in a particular area of East Lansing, Michigan and was analyzed using multiple linear regression and simple regression for each independent variable. The first two tables relate to the multiple regression analysis.
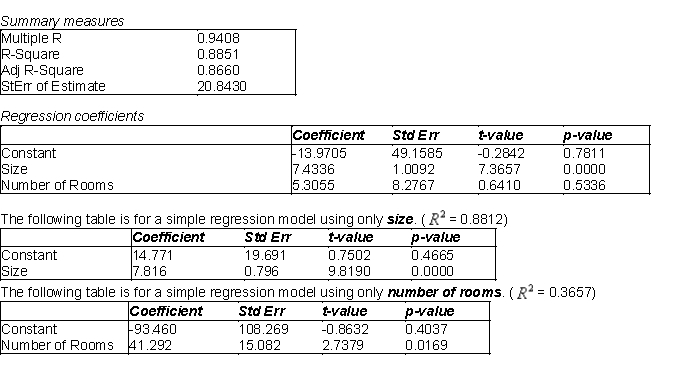
-(A) Use the information related to the multiple regression model to determine whether each of the regression coefficients are statistically different from 0 at a 5% significance level. Summarize your findings.
(B) Test at the 5% significance level the relationship between Y and X in each of the simple linear regression models. How does this compare to your answer in (A)? Explain.
(C) Is there evidence of multicollinearity in this situation? Explain why or why not.
Correct Answer:

Verified
(A) Given a p-value = 0 <  =.05, we reje...
View Answer
Unlock this answer now
Get Access to more Verified Answers free of charge
Correct Answer:
Verified
View Answer
Unlock this answer now
Get Access to more Verified Answers free of charge
Q17: Forward regression<br>A)begins with all potential explanatory variables
Q18: A multiple regression model involves 40 observations
Q29: If exact multicollinearity exists,redundancy exists in the
Q37: In regression analysis,multicollinearity refers to the<br>A)response variables
Q42: The value k in the number of
Q54: In multiple regressions, if the F-ratio is
Q55: In testing the overall fit of a
Q61: Which of the following is not one
Q63: Which statement is true regarding regression error,
Q105: In multiple regression, the problem of multicollinearity