Essay
A manufacturing firm wants to determine whether a relationship exists between the number of work-hours an employee misses per year (Y) and the employee's annual wages (X), to test the hypothesis that increased compensation induces better work attendance. The data provided in the table below are based on a random sample of 15 employees from this organization. 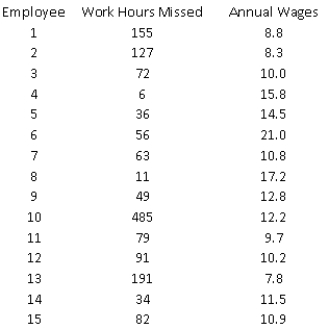
-(A) Estimate a simple linear regression model using the sample data. How well does the estimated model fit the sample data?
(B) Perform an F-test for the existence of a linear relationship between Y and X. Use a 5% level of significance.
(C) Plot the fitted values versus residuals associated with the model. What does the plot indicate?
(D) How do you explain the results you have found in (A) through (C)?
(E) Suppose you learn that the 10th employee in the sample has been fired for missing an excessive number of work-hours during the past year. In light of this information, how would you proceed to estimate the relationship between the number of work-hours an employee misses per year and the employee's annual wages, using the available information? If you decide to revise your estimate of this regression equation, repeat (A) and (B)
Correct Answer:

Verified
(A)
 The simple linear regression mode...
View Answer
Unlock this answer now
Get Access to more Verified Answers free of charge
Correct Answer:
Verified
View Answer
Unlock this answer now
Get Access to more Verified Answers free of charge
Q3: Heteroscedasticity means that the variability of Y
Q31: The term autocorrelation refers to the observation
Q69: The manager of a commuter rail transportation
Q70: Which approach can be used to test
Q71: Which definition best describes parsimony?<br>A) explaining the
Q72: A point that "tilts" the regression line
Q73: In a simple linear regression problem, if
Q76: Time series data often exhibits which of
Q77: A company that makes baseball caps would
Q78: In multiple regression with k explanatory variables,