Essay
Adjustors working for a large insurance agency are each given a company car which they use on the job to travel to client locations to inspect damage to homes and automobiles that are covered by the agency. Although the cars are owned by the agency, maintenance is currently left up to the discretion of the adjustors, who are reimbursed for any costs they report. The agency believes that the lack of a maintenance policy has led to unnecessary maintenance expenses. In particular, they believe that many agents wait too long to have maintenance performed on their company cars, and that in such cases, maintenance expenses are inordinately high. The agency recently conducted a study to investigate the relationship between the reported cost of maintenance visits for their company cars (Y) and the length of time since the last maintenance service (X). The sample data are shown below: 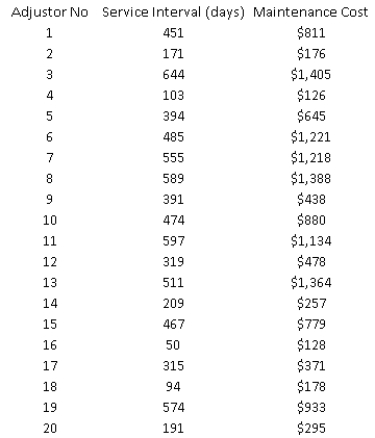
-(A) Estimate a simple linear regression model with Service Interval (X) and Maintenance Cost (Y). Interpret the slope coefficient of the least squares line as well as the computed value of  .
.
(B) Do you think this model proves the agency's point about maintenance? Explain your answer.
(C) Obtain a residual plot vs. Service Interval. Does this affect your opinion of the validity of the model in (A)?
(D) Obtain a scatterplot of Maintenance Cost vs. Service Interval. Does this affect your opinion of the validity of the model in (A)?
(E) Use what you have learned about transformations to fit an alternative model to the one in (A).
(F) Interpret the model you developed in (E). Does it help you assess the agency's claim? What should the agency conclude about the relationship between service interval and maintenance costs?
Correct Answer:

Verified
(A) 
(A) As the service interval incre...View Answer
Unlock this answer now
Get Access to more Verified Answers free of charge
Correct Answer:
Verified
(A) As the service interval incre...
View Answer
Unlock this answer now
Get Access to more Verified Answers free of charge
Q54: In a simple linear regression problem, if
Q55: The adjusted R<sup>2</sup> is adjusted for the
Q56: For the multiple regression model <img src="https://d2lvgg3v3hfg70.cloudfront.net/TB1387/.jpg"
Q57: In a simple regression analysis, if the
Q57: The least squares line is the line
Q58: The adjusted R<sup>2</sup> is used primarily to
Q61: A single variable X can explain a
Q63: In linear regression, we can have an
Q69: Correlation is measured on a scale from
Q76: If a scatterplot of residuals shows a