Short Answer
The results of inspection of samples of a product taken over the past 8 days are given below. Sample size for each day has been 120. 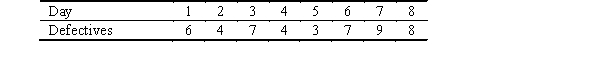 Determine the 97% upper and lower control limits for the p-chart.
Correct Answer:

Verified
Correct Answer:
Verified
Related Questions
Q1: A control chart that is used when
Q2: A production process is considered in control
Q4: The upper and lower control limits of
Q5: The maximum number of defective items that
Q6: Producer's risk is<br>A)the same as the Consumer's
Q7: A soft drink filling machine is set
Q8: A graph showing the probability of accepting
Q9: Consumer's risk is<br>A)the same concept as the
Q11: The upper and lower control limits of
Q13: In acceptance sampling, the risk of rejecting