Essay
Nancy, Inc. manufactures 4 ounce chocolate bars. Random samples of size four were taken and weighed. Eight hours of observation provided the following data. 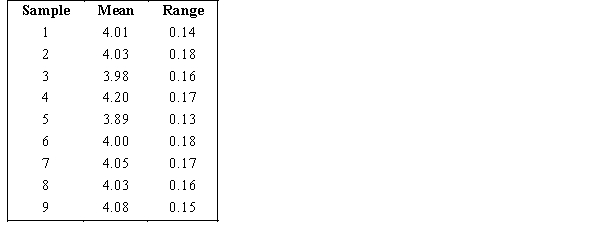
a. Determine the 3 sigma upper and lower control limits for the x-bar chart.
b. Determine the 3 sigma upper and lower control limits for the R-chart.
Correct Answer:

Verified
a. UCL = 4.09704
LCL...View Answer
Unlock this answer now
Get Access to more Verified Answers free of charge
Correct Answer:
Verified
LCL...
View Answer
Unlock this answer now
Get Access to more Verified Answers free of charge
Q14: Brakes Shop, Inc., is a franchise that
Q15: Normal or natural variations in process outputs
Q16: A group of items such as incoming
Q17: A production process that is in
Q18: The upper and lower control limits of
Q20: The upper and lower control limits of
Q21: A production process is considered in control
Q22: If the lower-control limit of a P
Q23: A production process is considered in control
Q24: The results of inspection of samples of