Essay
Actual sales of a company (in millions of dollars) for January through April are shown below. 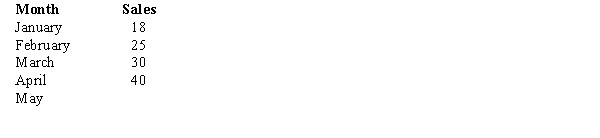
a.Use  = 0.3 to compute the exponential smoothing values for sales. Compute MSE and forecast sales for May. Show all of your computations from February through May.
b.Use  = 0.1 to compute the exponential smoothing values for sales. Compute MSE and forecast sales for May. Show all of your computations from February through May.
c.Based on MSE, which  provides a better forecast? Explain why?
Correct Answer:

Verified
 c. = 0.30 yields ...
View Answer
Unlock this answer now
Get Access to more Verified Answers free of charge
Correct Answer:
Verified
View Answer
Unlock this answer now
Get Access to more Verified Answers free of charge
Q27: Which of the following smoothing constants would
Q28: Demand for a product and the forecasting
Q29: Actual sales for January through April are
Q30: John has collected the following information on
Q31: The time series component that reflects gradual
Q33: The time series component that reflects variability
Q34: Exhibit 18-2<br>Consider the following time series. <img
Q35: Exhibit 18-2<br>Consider the following time series. <img
Q36: The sales volumes of CMM, Inc., a
Q37: Consider the following annual series on the