Essay
The quarterly sales of a company (in millions of dollars) over the past three years are given in the following table. 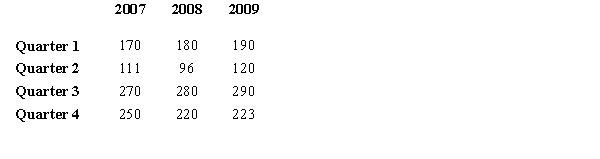
a.Compute the four seasonal factors (Seasonal Indexes). Show all of your computations.
b.The trend for these data is Trend = 174 + 4 t (t represents time, where t=1 for Quarter 1 of 2007 and t=12 for Quarter 4 of 2009). Forecast sales for the first quarter of 2010 using the trend and seasonal indexes. Show all of your computations.
Correct Answer:

Verified
a.  b.Trend = 174 + 4 t = 174 ...
View Answer
Unlock this answer now
Get Access to more Verified Answers free of charge
Correct Answer:
Verified
View Answer
Unlock this answer now
Get Access to more Verified Answers free of charge
Q54: Below you are given information on John's
Q55: The sales records of a company over
Q56: Exhibit 18-3<br>Consider the following time series. <img
Q57: Exhibit 18-3<br>Consider the following time series. <img
Q58: A group of observations measured at successive
Q60: What is the forecast for July based
Q61: One measure of the accuracy of a
Q62: A parameter of the exponential smoothing model
Q63: Exhibit 18-3<br>Consider the following time series. <img
Q64: The following time series shows the