Essay
The quarterly sales of a company (in millions of dollars) over the past three years are given in the following table. 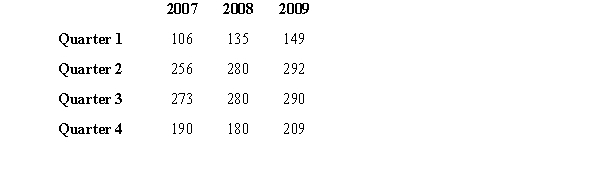
a.Compute the four seasonal factors (Seasonal Indexes). Show all of your computations.
b.The trend for these data is Trend = 185.86 + 5.25 t (t represents time, where t=1 for Quarter 1 of 2007 and t=12 for Quarter 4 of 2009). Forecast sales for the first quarter of 2010 using the trend only. Show all of your computations.
c.Forecast sales for the first quarter of 2010 using the trend and seasonal indexes and write your answer below. Show all of your computations.
Correct Answer:

Verified
Correct Answer:
Verified
Q11: A qualitative forecasting method that obtains forecasts
Q13: If data for a time series analysis
Q43: You are given the following information on
Q44: The yearly series below exhibits a long-term
Q45: You are given the following information on
Q46: What is the forecast for July based
Q49: Below you are given some values of
Q50: For the following time series, you are
Q51: Exhibit 18-2<br>Consider the following time series. <img
Q53: The following information has been collected on