Multiple Choice
Exhibit 16-1
In a regression analysis involving 25 observations, the following estimated regression equation was developed. 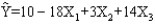 Also, the following standard errors and the sum of squares were obtained.
Sb1 = 3
Sb2 = 6
Sb3 = 7
SST = 4,800
SSE = 1,296
-Refer to Exhibit 16-1. If you want to determine whether or not the coefficients of the independent variables are significant, the critical value of t statistic at = 0.05 is
A) 2.080
B) 2.060
C) 2.064
D) 1.96
Correct Answer:

Verified
Correct Answer:
Verified
Q3: Multiple regression analysis was used to
Q4: When dealing with the problem of non-constant
Q5: Exhibit 16-4<br>In a laboratory experiment, data were
Q6: A regression analysis was applied in order
Q7: Part of an Excel output relating Y
Q9: Exhibit 16-4<br>In a laboratory experiment, data were
Q10: Exhibit 16-2<br>In a regression model involving 30
Q11: In multiple regression analysis, the general linear
Q12: We want to test whether or not
Q13: Exhibit 16-4<br>In a laboratory experiment, data were