Essay
A sample of 25 families was taken. The objective of the study was to estimate the factors that determine the monthly expenditure on food for families. The independent variables included in the analysis were the number of members in the family (X1), the number of meals eaten outside the home (X2), and a dummy variable (X3) that equals 1 if a family member is on a diet and equals 0 if there is no family member on a diet. The following results were obtained. 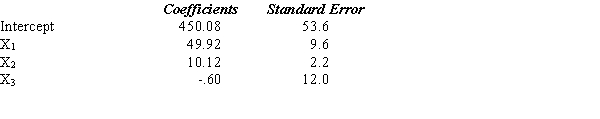 Analysis of Variance
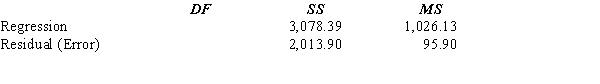
a. Write out the estimated regression equation.
b. Interpret all coefficients.
c. Test for the significance of ?1, ?2, and ?3 at the 1% level of significance.d. What are the degrees of freedom for the sum of squares explained by the regression (SSR) and the sum of squares due to error (SSE)?
e. Test whether of not there is a significant relationship between the monthly expenditure on food and the independent variables. Use a .01 level of significance. Be sure to state the null and alternative hypotheses.
f. Compute the coefficient of determination and explain its meaning.
g. Estimate the monthly expenditure on food for a family that has 4 members, eats out 3 times, and does not have any member of the family on a diet.
b.Interpret all coefficients.
c.Test for the significance of 1, 2, and 3 at the 1% level of significance.
d.What are the degrees of freedom for the sum of squares explained by the regression (SSR) and the sum of squares due to error (SSE)?
e.Test whether of not there is a significant relationship between the monthly expenditure on food and the independent variables. Use a .01 level of significance. Be sure to state the null and alternative hypotheses.
Correct Answer:

Verified
a.  = 450.08 + 49.92X1 + 10.12X2 - 0.6X3
b....View Answer
Unlock this answer now
Get Access to more Verified Answers free of charge
Correct Answer:
Verified
b....
View Answer
Unlock this answer now
Get Access to more Verified Answers free of charge
Q66: In a multiple regression model, the
Q67: In a multiple regression model, the
Q68: The ratio of MSE/MSR yields<br>A)SST<br>B)the F statistic<br>C)SSR<br>D)None
Q69: In a multiple regression analysis involving 12
Q70: Exhibit 15-8<br>The following estimated regression model was
Q72: Exhibit 15-2<br>A regression model between sales (Y
Q73: Exhibit 15-8<br>The following estimated regression model was
Q74: Exhibit 15-3<br>In a regression model involving 30
Q75: Exhibit 15-6<br>Below you are given a partial
Q76: The adjusted multiple coefficient of determination is