Essay
Shown below is a portion of an Excel output for regression analysis relating Y (dependent variable) and X (independent variable). 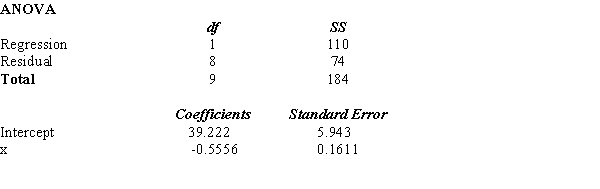
a. What has been the sample size for the above?
b. Perform a t test and determine whether or not X and Y are related. Let = 0.05.
c. Perform an F test and determine whether or not X and Y are related. Let = 0.05.
d. Compute the coefficient of determination.
e. Interpret the meaning of the value of the coefficient of determination that you found in d. Be very specific.
Correct Answer:

Verified
a through d  e.59....
View Answer
Unlock this answer now
Get Access to more Verified Answers free of charge
Correct Answer:
Verified
View Answer
Unlock this answer now
Get Access to more Verified Answers free of charge
Q91: Given below are five observations collected
Q92: Exhibit 14 - 1<br>The following information regarding
Q93: Exhibit 14-5<br>The following information regarding a dependent
Q96: Jason believes that the sales of coffee
Q97: The mathematical equation relating the independent
Q98: Given below are seven observations collected
Q99: Exhibit 14-10<br>The following information regarding a dependent
Q100: A regression analysis between sales (in $1000)
Q109: Larger values of r<sup>2</sup> imply that the
Q121: Exhibit 14-10<br>The following information regarding a dependent