Essay
The following data show the results of an aptitude test (Y) and the grade point average of 10 students. 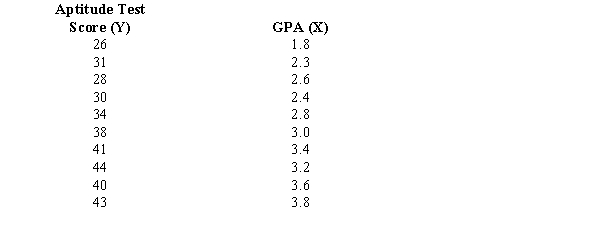
a.Develop a least squares estimated regression line.
b.Compute the coefficient of determination and comment on the strength of the regression relationship.
c.Is the slope significant? Use a t test and let = 0.05.
d.At 95% confidence, test to determine if the model is significant (i.e., perform an F test).
Correct Answer:

Verified
a.  = 8.171 + 9.4564X
b.0.83; there is a...View Answer
Unlock this answer now
Get Access to more Verified Answers free of charge
Correct Answer:
Verified
b.0.83; there is a...
View Answer
Unlock this answer now
Get Access to more Verified Answers free of charge
Q28: Exhibit 14-3<br>You are given the following information
Q29: The following data represent the number
Q30: The value of the coefficient of correlation
Q31: The equation that describes how the dependent
Q32: If the coefficient of determination is a
Q34: Exhibit 14-9<br>A regression and correlation analysis resulted
Q35: Assume you have noted the following
Q36: In the following estimated regression equation <img
Q37: Exhibit 14-7<br>You are given the following information
Q38: Exhibit 14-2<br>You are given the following information