Essay
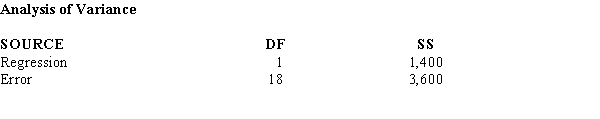
Shown below is a portion of the computer output for a regression analysis relating sales (Y in millions of dollars) and advertising expenditure (X in thousands of dollars). 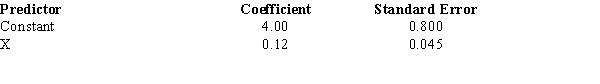
a. What has been the sample size for the above?
b. Perform a t test and determine whether or not advertising and sales are related. Let = 0.05.
c. Compute the coefficient of determination.
d. Interpret the meaning of the value of the coefficient of determination that you found in Part c. Be very specific.e. Use the estimated regression equation and predict sales for an advertising expenditure of $4,000. Give your answer in dollars.
Correct Answer:

Verified
a.20
b.t = 2.66; p-value is be...View Answer
Unlock this answer now
Get Access to more Verified Answers free of charge
Correct Answer:
Verified
b.t = 2.66; p-value is be...
View Answer
Unlock this answer now
Get Access to more Verified Answers free of charge
Q23: The coefficient of correlation<br>A)is the square of
Q118: Shown below is a portion of
Q119: Exhibit 14 - 1<br>The following information regarding
Q120: Exhibit 14-3<br>You are given the following information
Q121: Exhibit 14-10<br>The following information regarding a dependent
Q122: Exhibit 14-10<br>The following information regarding a dependent
Q125: If the coefficient of correlation is a
Q126: Exhibit 14-6<br>For the following data the value
Q127: Exhibit 14-4<br>Regression analysis was applied between sales
Q128: In regression analysis if the dependent variable