Multiple Choice
Exhibit 13-2 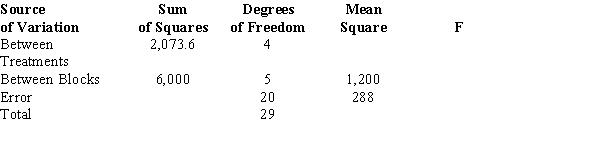
-Refer to Exhibit 13-2. The test statistic to test the null hypothesis equals
A) 0.432
B) 1.8
C) 4.17
D) 28.8
Correct Answer:

Verified
Correct Answer:
Verified
Related Questions
Q1: Part of an ANOVA table is
Q2: Three different brands of tires were compared
Q3: The following are the results from
Q5: Exhibit 13-6<br>Part of an ANOVA table is
Q6: Exhibit 13-7<br>The following is part of an
Q7: An experimental design where the experimental units
Q8: A factorial experiment involving 2 levels
Q9: Exhibit 13-5<br>Part of an ANOVA table is
Q10: Exhibit 13-6<br>Part of an ANOVA table is
Q11: Information regarding the ACT scores of samples