Multiple Choice
Exhibit 13-7
The following is part of an ANOVA table that was obtained from data regarding three treatments and a total of 15 observations. 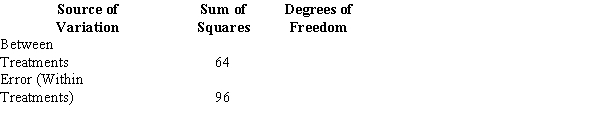
-Refer to Exhibit 13-7. If at 95% confidence, we want to determine whether or not the means of the populations are equal, the p-value is
A) between 0.01 to 0.025
B) between 0.025 to 0.05
C) between 0.05 to 0.1
D) greater than 0.1
Correct Answer:

Verified
Correct Answer:
Verified
Q15: Exhibit 13-2 <img src="https://d2lvgg3v3hfg70.cloudfront.net/TB2206/.jpg" alt="Exhibit 13-2
Q16: Exhibit 13-5<br>Part of an ANOVA table is
Q17: Eight observations were selected from each
Q18: Five drivers were selected to test
Q19: In an analysis of variance, one
Q21: Samples were selected from three populations. The
Q22: Exhibit 13-1 <img src="https://d2lvgg3v3hfg70.cloudfront.net/TB2206/.jpg" alt="Exhibit 13-1
Q23: Exhibit 13-2 <img src="https://d2lvgg3v3hfg70.cloudfront.net/TB2206/.jpg" alt=" Exhibit
Q24: A dietician wants to see if there
Q25: In a completely randomized experimental design, 11