Multiple Choice
Exhibit 12-5
The table below gives beverage preferences for random samples of teens and adults. 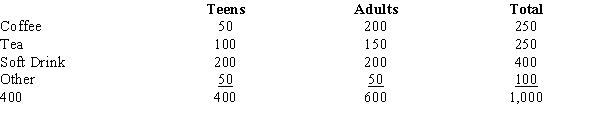 We are asked to test for independence between age (i.e., adult and teen) and drink preferences.
-Refer to Exhibit 12-5. The p-value is
A) between .1 and .05
B) between .05 and .025
C) between .025 and .01
D) less than 0.005
Correct Answer:

Verified
Correct Answer:
Verified
Q55: Dr. Maria Pecora diet pills are supposed
Q56: Exhibit 12-6<br>The owner of a car wash
Q57: Exhibit 12-7<br>You want to test whether or
Q58: Marascuillo procedure is used for testing the
Q59: In 2002, forty percent of the students
Q61: Exhibit 12-7<br>You want to test whether or
Q62: Before the start of the Winter
Q63: Exhibit 12-2<br>Last school year, the student body
Q64: The data below represents the fields
Q65: A major automobile manufacturer claimed that