Essay
Prior to the start of the season, it was expected that audience proportions for the four major news networks would be CBS 28%, NBC 35%, ABC 22% and BBC 15%. A recent sample of homes yielded the following viewing audience data. 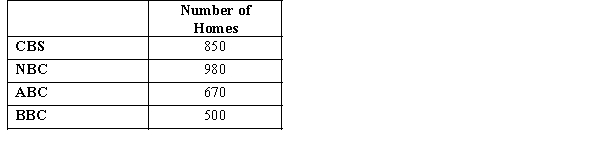 We want to determine whether or not the recent sample supports the expectations of the number of homes of the viewing audience of the four networks.
a.State the null and alternative hypotheses to be tested.
b.Compute the test statistic.
c.The null hypothesis is to be tested at 95% confidence. Determine the critical value for this test.
d.What do you conclude?
Correct Answer:

Verified
a.Ho: P1 =.28, P2 = .35, P3 = .22, P4 = .5
Ha: ...View Answer
Unlock this answer now
Get Access to more Verified Answers free of charge
Correct Answer:
Verified
Ha: ...
View Answer
Unlock this answer now
Get Access to more Verified Answers free of charge
Q71: Exhibit 12-5<br>The table below gives beverage preferences
Q72: Use <span class="ql-formula" data-value="\alpha"><span class="katex"><span
Q73: A lottery is conducted that involves the
Q74: Exhibit 12-7<br>You want to test whether or
Q75: A manager believes that the shelf life
Q77: Last school year, in the school
Q78: Exhibit 12-2<br>Last school year, the student body
Q79: Exhibit 12-8<br>The following shows the number of
Q80: Exhibit 12-6<br>The owner of a car wash
Q81: A statistical test conducted to determine whether