Essay
From a poll of 800 television viewers, the following data have been accumulated as to their levels of education and their preference of television stations. We are interested in determining if the selection of a TV station is independent of the level of education.
Educational Level 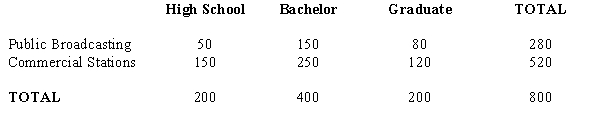
a.State the null and the alternative hypotheses.
b.Show the contingency table of the expected frequencies.
c.Compute the test statistic.
d.The null hypothesis is to be tested at 95% confidence. Determine the critical value for this test.
e.Determine the p-value and perform the test.
Correct Answer:

Verified
Correct Answer:
Verified
Q14: Exhibit 12-2<br>Last school year, the student body
Q15: A group of 2000 individuals from
Q16: A group of 500 individuals were
Q17: We want to determine if the following
Q18: Exhibit 12-3<br>In order to determine whether or
Q20: Exhibit 12-4<br>In the past, 35% of the
Q21: Exhibit 12-8<br>The following shows the number of
Q22: Exhibit 12-1<br>When individuals in a sample of
Q23: Two hundred fifty managers with degrees in
Q24: Exhibit 12-1<br>When individuals in a sample of