Essay
Shown below is 3 x 2 contingency table with observed values from a sample of 1,500. At 95% confidence, test for independence of the row and column factors. 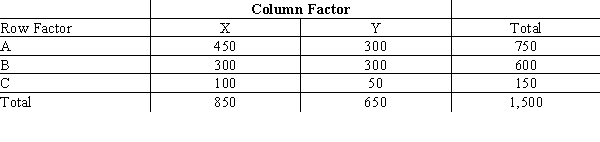
Correct Answer:

Verified
 2 = 20.36; p-value is...
View Answer
Unlock this answer now
Get Access to more Verified Answers free of charge
Correct Answer:
Verified
View Answer
Unlock this answer now
Get Access to more Verified Answers free of charge
Related Questions
Q41: Exhibit 12-4<br>In the past, 35% of the
Q42: The degrees of freedom for a contingency
Q43: Exhibit 12-1<br>When individuals in a sample of
Q44: Exhibit 12-2<br>Last school year, the student body
Q45: A population where each element of the
Q47: Among 1,000 managers with degrees in
Q48: The sampling distribution for a goodness of
Q49: Exhibit 12-6<br>The owner of a car wash
Q50: Testing the equality of three or more
Q51: Exhibit 12-3<br>In order to determine whether or