Essay
Shown below is 2 x 3 contingency table with observed values from a sample of 500. At 95% confidence using the critical value approach, test for independence of the row and column factors. 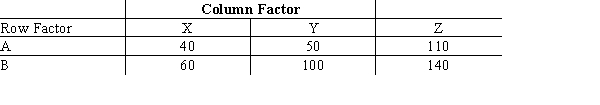
Correct Answer:

Verified
 2 = 4.44 < 5...
View Answer
Unlock this answer now
Get Access to more Verified Answers free of charge
Correct Answer:
Verified
View Answer
Unlock this answer now
Get Access to more Verified Answers free of charge
Q77: Last school year, in the school
Q78: Exhibit 12-2<br>Last school year, the student body
Q79: Exhibit 12-8<br>The following shows the number of
Q80: Exhibit 12-6<br>The owner of a car wash
Q81: A statistical test conducted to determine whether
Q83: The number of degrees of freedom for
Q84: A sample of 150 individuals (males and
Q85: Shoppers were asked where they do their
Q86: If there are three or more populations,
Q87: The results of a recent study regarding