Multiple Choice
Exhibit 3-1
The following data show the number of hours worked by 200 statistics students. 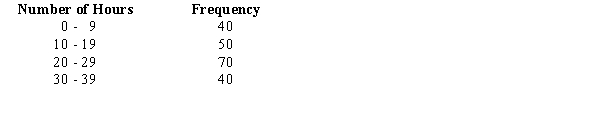
-Refer to Exhibit 3-1. The cumulative relative frequency for the class of 10 - 19
A) is 90
B) is .25
C) is .45
D) cannot be determined from the information given
Correct Answer:

Verified
Correct Answer:
Verified
Q22: The relative frequency of a class is
Q99: Given the following information: Standard deviation =
Q132: Descriptive statistics for the closing stock prices
Q133: Exhibit 3-5<br>You are given the following frequency
Q134: In computing descriptive statistics from grouped data,<br>A)data
Q135: The hourly wages of a sample of
Q136: Which of the following is a measure
Q139: Which of the following symbols represents
Q140: Exhibit 3-2<br>A researcher has collected the following
Q141: The following data show the yearly salaries