Short Answer
The ages of a sample of 8 faculty members selected from the School of Business Administration are shown below. 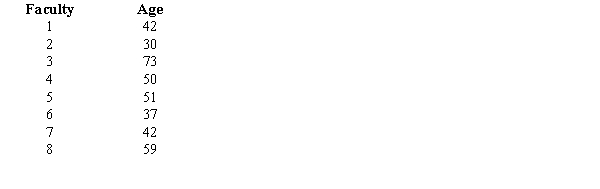
a.Compute the average age.
b.Determine the mode.
c.Compute the median age.
d.Compute the standard deviation.
Correct Answer:

Verified
a.48
b.42
...View Answer
Unlock this answer now
Get Access to more Verified Answers free of charge
Correct Answer:
Verified
b.42
...
View Answer
Unlock this answer now
Get Access to more Verified Answers free of charge
Q5: The geometric mean of 2, 4, 8
Q6: The most frequently occurring value of a
Q7: From a population of size 1,000, a
Q7: In the last month, Nancy purchased gasoline
Q9: The following data show the yearly salaries
Q11: The following observations are given for two
Q12: The interquartile range is<br>A)the 50th percentile<br>B)another name
Q13: The coefficient of correlation ranges between<br>A)0 and
Q14: The median of a sample will always
Q42: When computing the mean, the smallest value<br>A)