Short Answer
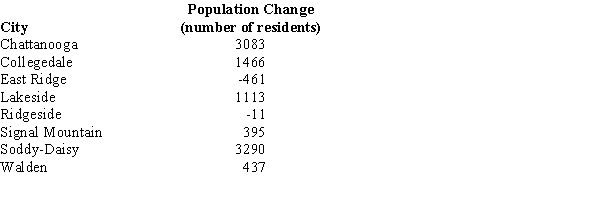
The population change between 2000 and 2010 for several small cities are shown below.  For the above sample, determine the following measures.
a.The mean
b.The standard deviation
c.The median
Correct Answer:

Verified
a.1,164
b....View Answer
Unlock this answer now
Get Access to more Verified Answers free of charge
Correct Answer:
Verified
b....
View Answer
Unlock this answer now
Get Access to more Verified Answers free of charge
Q44: The measure of location which is the
Q72: The sum of deviations of the individual
Q161: Exhibit 3-3<br>A researcher has collected the following
Q162: The mean of the sample<br>A)is always smaller
Q164: Since the population size is always larger
Q165: Which of the following is not a
Q167: The yearly incomes of the top highest
Q168: <span class="ql-formula" data-value="\mu"><span class="katex"><span class="katex-mathml"><math xmlns="http://www.w3.org/1998/Math/MathML"><semantics><mrow><mi>μ</mi></mrow><annotation encoding="application/x-tex">\mu</annotation></semantics></math></span><span
Q169: Exhibit 3-4<br>The following is the frequency distribution
Q170: The variance of a sample was reported