Essay
Forty shoppers were asked if they preferred the weight of a can of soup to be 6 ounces, 8 ounces, or 10 ounces. Below you are given their responses. 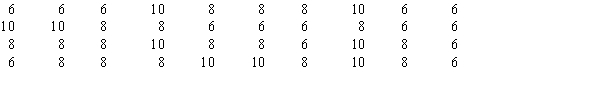
a.Construct a frequency distribution and graphically represent the frequency distribution.
b.Construct a relative frequency distribution and graphically represent the relative frequency distribution.
Correct Answer:

Verified
Correct Answer:
Verified
Q22: The relative frequency of a class is
Q32: The frequency distribution below was constructed from
Q33: Exhibit 2-4<br>Michael's Compute-All, a national computer retailer,
Q35: A graphical presentation of the relationship between
Q36: Exhibit 2-4<br>Michael's Compute-All, a national computer retailer,
Q38: Exhibit 2-4<br>Michael's Compute-All, a national computer retailer,
Q39: In constructing a frequency distribution, the approximate
Q40: The reversal of conclusions based on aggregate
Q41: A sample of the ages of 10
Q42: Exhibit 2-3<br>A survey of 800 college seniors