Essay
The ACT scores of a sample of business school students and their genders are shown below. 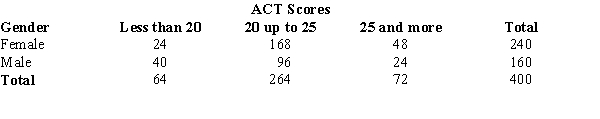
a.How many students scored less than 20?
b.How many students were female?
c.Of the male students, how many scored 25 or more?
d.Compute row percentages and comment on any relationship that may exist between ACT scores and gender of the individuals.
e.Compute column percentages.
Correct Answer:

Verified
Correct Answer:
Verified
Q20: Categorical data can be graphically represented by
Q22: There are 800 students in the School
Q23: Which of the following is a graphical
Q24: The most common graphical presentation of quantitative
Q26: A situation in which conclusions based upon
Q27: The following data set shows the number
Q28: Exhibit 2-3<br>A survey of 800 college seniors
Q29: Below you are given the examination scores
Q30: A frequency distribution is<br>A)a tabular summary of
Q46: In a cumulative percent frequency distribution, the