Multiple Choice
Which graph represents a negative linear relationship between x and y? 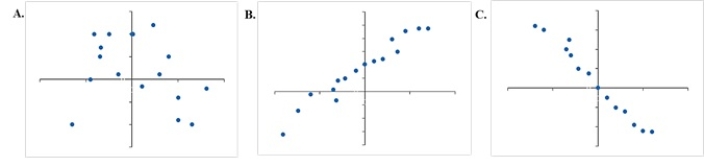
A) A
B) B
C) C
D) None of the graphs display a negative linear relationship.
Correct Answer:

Verified
Correct Answer:
Verified
Related Questions
Q18: The _ shows the number of data
Q19: When working with data sets in Excel,
Q20: A summary of data that shows the
Q21: The letter grades (A, B, C, D,
Q22: Use technology to compute the standard deviation
Q24: In a survey of patients in a
Q25: A _ determines how far a particular
Q26: Compute the relative frequencies for the
Q27: The correlation coefficient will always take values<br>A)greater
Q28: _ acts as a representative of the