Multiple Choice
Consider the clustered bar chart of the dashboard developed to monitor the performance of a call center: 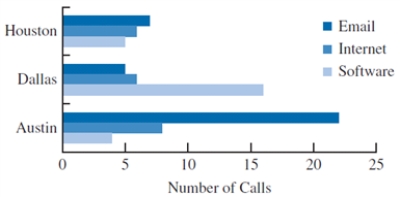 This chart allows the IT manager to
A) identify how often a problem is related to hardware.
B) identify the frequency of a particular type of problem by location.
C) identify which city contains the most customers.
D) identify the percent of customers who do not have one of the listed problems.
Correct Answer:

Verified
Correct Answer:
Verified
Q25: The data dashboard for a marketing manager
Q26: Which of the following graphs cannot be
Q27: To summarize and analyze data with both
Q28: A _ is a graphical presentation of
Q29: Construct a scatter chart for the
Q31: A useful chart for displaying multiple variables
Q32: Deleting the grid lines in a table
Q33: Tables should be used instead of charts
Q34: Using multiple lines on a line chart
Q35: In many cases, white space in a