Multiple Choice
This Excel bar chart displays the demographics of a Business Analysis class. Approximately how many students are in the class? 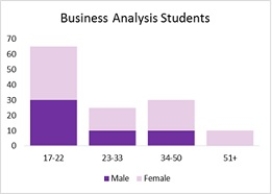
A) 175
B) 150
C) 105
D) 130
Correct Answer:

Verified
Correct Answer:
Verified
Related Questions
Q37: An effective display of trend and magnitude
Q38: Bar charts use<br>A)horizontal bars to display the
Q39: The software package most commonly used for
Q40: The best way to differentiate chart elements
Q41: A two-dimensional graph representing the data using
Q42: An alternative for a stacked column chart
Q43: In order to visualize three variables in
Q44: A _ is a line that provides
Q46: A disadvantage of stacked-column charts and stacked-bar
Q47: Fields may be chosen to represent all