Multiple Choice
The scatter chart below displays the residuals versus the dependent variable, x. Which of the following conclusions can be drawn from the scatter chart given below? 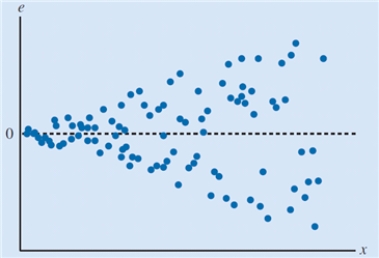
A) The residuals have an increasing variance as the dependent variable increases.
B) The model captures the relationship between the variables accurately.
C) The regression model follows the standard normal probability distribution.
D) The residual distribution is consistently scattered about zero.
Correct Answer:

Verified
Correct Answer:
Verified
Q33: In a simple linear regression analysis the
Q34: The graph of the simple linear regression
Q35: _ is used to test the hypothesis
Q36: A variable used to model the effect
Q37: Which of the following regression models is
Q39: The _ is a measure of the
Q40: What would be the coefficient of determination
Q41: In a linear regression model, the variable
Q42: Fitting a model too closely to sample
Q43: The _ is a measure of the