Multiple Choice
The scatter chart below displays the residuals versus the dependent variable, t. Which of the following conclusions can be drawn based upon this scatter chart? 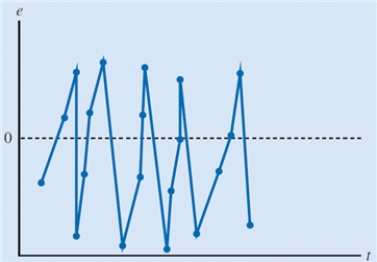
A) model is time-invariant.
B) model captures the relationship between the variables accurately.
C) residuals are not independent.
D) residuals are normally distributed.
Correct Answer:

Verified
Correct Answer:
Verified
Q1: In the simple linear regression model, the
Q2: Prediction of the value of the dependent
Q3: _ refers to the use of sample
Q5: _ refers to the data set used
Q6: In the graph of the simple linear
Q7: The degree of correlation among independent variables
Q8: Prediction of the mean value of the
Q9: In the graph of the simple linear
Q10: Regression analysis involving one dependent variable and
Q11: The process of making a conjecture about